Encountering a bug can bring productivity to a halt, turning a smooth coding session into a frustrating hunt for an elusive error. The key to reclaiming that lost time is not just about finding the bug, but about finding it efficiently through a structured and repeatable process.
In the world of software development, debugging is an essential and often time-consuming activity. For Python developers, the language's dynamic nature can sometimes lead to runtime errors that are tricky to trace. However, with the right techniques and tools, you can significantly reduce the time you spend troubleshooting. This guide provides a comprehensive overview of practical, step-by-step strategies that will teach you how to debug Python code faster, transforming a dreaded task into a methodical, efficient, and even educational part of your workflow.
This article moves beyond the basics of `print()` statements, exploring a robust debugging framework that incorporates logging, interactive debuggers, and proactive code analysis. By adopting these methods, you will not only solve problems more quickly but also improve your overall code quality and gain a deeper understanding of your application's behavior. Whether you're a student new to Python or an experienced programmer looking to refine your Python troubleshooting guide, these proven techniques will make you a more effective and efficient developer.
The Foundational Mindset: Before You Write a Single `print()`
The most powerful debugging tool is not a piece of software, but a systematic mindset. Before diving into code and scattering `print()` statements, a moment of structured thinking can save hours of frustration. The first and most critical step is to reliably reproduce the bug. If you cannot trigger the error on demand, you are merely guessing. Document the exact inputs, user actions, or system states that cause the failure. Try to create a minimal, reproducible example—the smallest possible piece of code that still exhibits the problem. This act of isolation is often halfway to the solution.
Once you can reproduce the bug, the next step is to form a hypothesis. Analyze the traceback, if one exists. What does the error message say? On which line did it occur? Read the code in that area and make an educated guess about the root cause. For example: "I hypothesize the `user_id` is `None` when the `calculate_metrics` function is called, leading to an `AttributeError`." This simple statement gives your debugging process direction. Your goal now is no longer to "find the bug" but to prove or disprove this specific hypothesis. This scientific approach is a cornerstone of faster Python debugging.
The Golden Rule of Debugging: If you can't consistently and reliably reproduce a bug, you can't effectively debug it. Isolate the problem with the simplest possible case before you begin inspecting code.
Technique 1: Strategic Logging for Greater Insight
While `print()` is the most intuitive debugging tool, it has significant drawbacks. The output is unstructured, it must be manually removed from production code, and it offers no sense of severity. A far superior approach is to use Python's built-in `logging` module. Logging allows you to record events with varying levels of importance, direct messages to different outputs (like the console or a file), and include rich contextual information such as timestamps and function names—all of which can be configured without changing the application code.
The power of the `logging` module comes from its hierarchical levels: `DEBUG`, `INFO`, `WARNING`, `ERROR`, and `CRITICAL`. During development, you can set the logging level to `DEBUG` to get verbose output about variable states and program flow. In production, you can raise the level to `WARNING` or `ERROR` to only capture significant issues. This allows you to leave your insightful logging statements in the code, ready to be activated when a problem arises. This is one of the most effective Python debugging tips for building maintainable, long-term applications.
Technique 2: The Interactive Python Debugger (pdb)
When logging isn't enough and you need to inspect the state of your program at a specific moment, the Python Debugger (`pdb`) is your best friend. `pdb` is an interactive source code debugger that allows you to pause your program's execution, inspect the values of variables, and step through your code line by line. To use it, you simply need to insert the line `import pdb; pdb.set_trace()` at the location in your code where you want to begin debugging. When the Python interpreter reaches this line, it will pause and drop you into an interactive session in your terminal.
Inside the `(Pdb)` prompt, you have a suite of commands at your disposal. The most common are `n` (next line), which executes the current line and moves to the next one in the same function; `c` (continue), which resumes normal execution until another breakpoint is hit; `l` (list), which shows you where you are in the code; and `p
"I used to just litter my code with `print()` statements and hope for the best. Learning to use `pdb` and a proper logging strategy was a complete game-changer. It not only cut my debugging time in half but also forced me to understand what my code was actually doing."
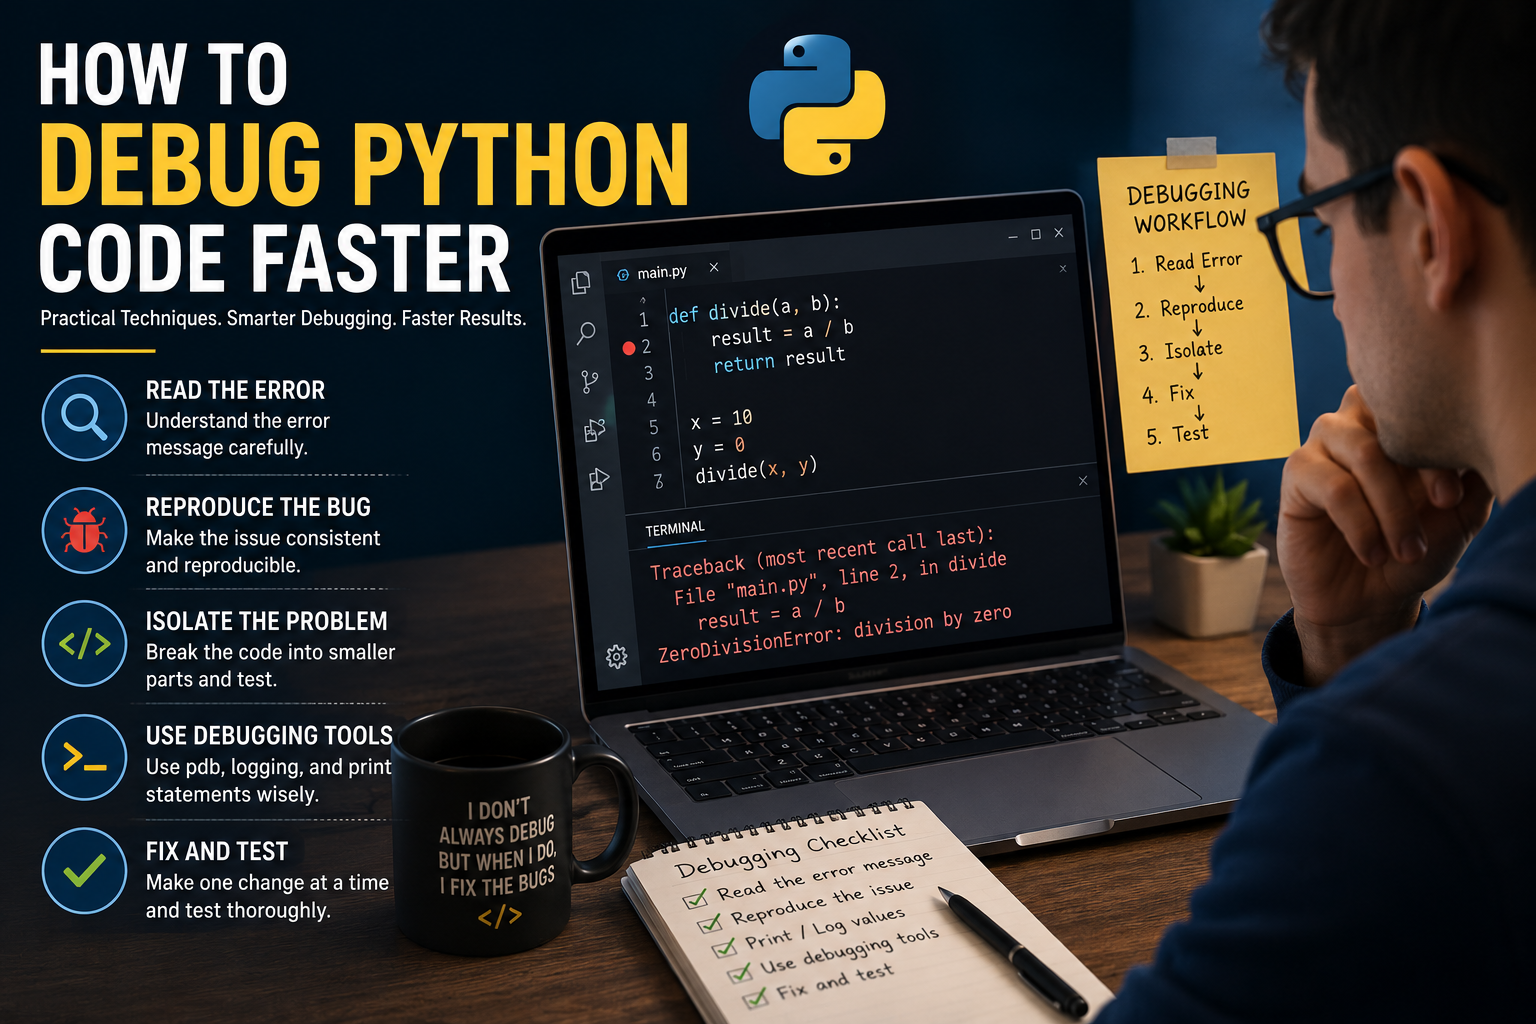
How It Works: A Structured Debugging Workflow
Advanced & Proactive Techniques
Beyond reactive debugging, several proactive strategies can help you catch errors before they even happen. `assert` statements are a simple yet powerful way to enforce your assumptions in code. An assertion declares a condition that must be true for the program to be correct. For example, `assert user_id is not None, "user_id cannot be None"` will raise an `AssertionError` if the condition is false. This helps catch bugs early and makes your code self-documenting. Assertions are typically used during development and are automatically disabled in production mode, so they have no performance overhead on live applications.
Furthermore, integrating static analysis tools into your workflow is one of the best investments you can make in faster debugging. Linters like `Pylint` and `Flake8` analyze your code without running it, catching stylistic errors, potential bugs, and anti-patterns. Type checkers like `Mypy` go a step further by verifying type hints, preventing a whole class of `TypeError` bugs that are common in dynamic languages. By catching these issues in your editor before you even run the code, you eliminate entire cycles of running, failing, and debugging.
Proactive vs. Reactive Debugging: Static analysis tools and assertions find errors before you run the code, saving you entire debugging cycles and improving code quality from the very beginning.
Ready to Write Bug-Free Code Faster?
Let our academic experts help you master advanced debugging and elevate your Python programming skills.